Andrii Yalanskyi
By Dr. Mark Shore and Michael Copeland
At a Glance
- CME Group’s volatility index CVOL, is a suite of implied 30-day forward volatility indices measuring 30-day forward volatility across all option strike prices of key futures markets
- Higher convexity translates to greater price volatility for out-of-the-money options from the current market price
Market sentiment can be challenging to quantify, but financial analysts and traders have a powerful tool to help them gauge it: CME Group’s Volatility Index, or CVOL. This index is particularly useful for navigating market uncertainty, especially through its convexity metric.
What is CVOL Convexity?
CVOL convexity is the ratio of CVOL (implied 30-day forward volatility) divided by the market’s at-the-money implied volatility. It measures the excess variance in the out-of-the-money options strike prices relative to the at-the-money options. This metric is useful for assessing the market’s level of uncertainty and its expectations for future price movements.
Higher convexity indicates greater price volatility for out-of-the-money options relative to the current market price. This suggests increased market uncertainty about future price movements, with the expectation that the underlying futures price will deviate from its current level. Essentially, higher convexity reflects a growing sense of future uncertainty in the options market, beyond what is indicated by volatility alone.
Examples of Convexity in Action
1. U.S. Treasury Futures
Daily convexity across the yield curve from 2013 to 2022 highlights two key points: Convexity tends to be more sensitive in the shorter end of the yield curve, thus greater variance as yields may be moving higher or lower.
In 2013, it was the “taper tantrum” when the Fed was reducing their quantitative easing, causing Treasury markets to move. In 2020 and 2021 due to COVID-19, supply chain shocks and higher inflation saw increased convexity.
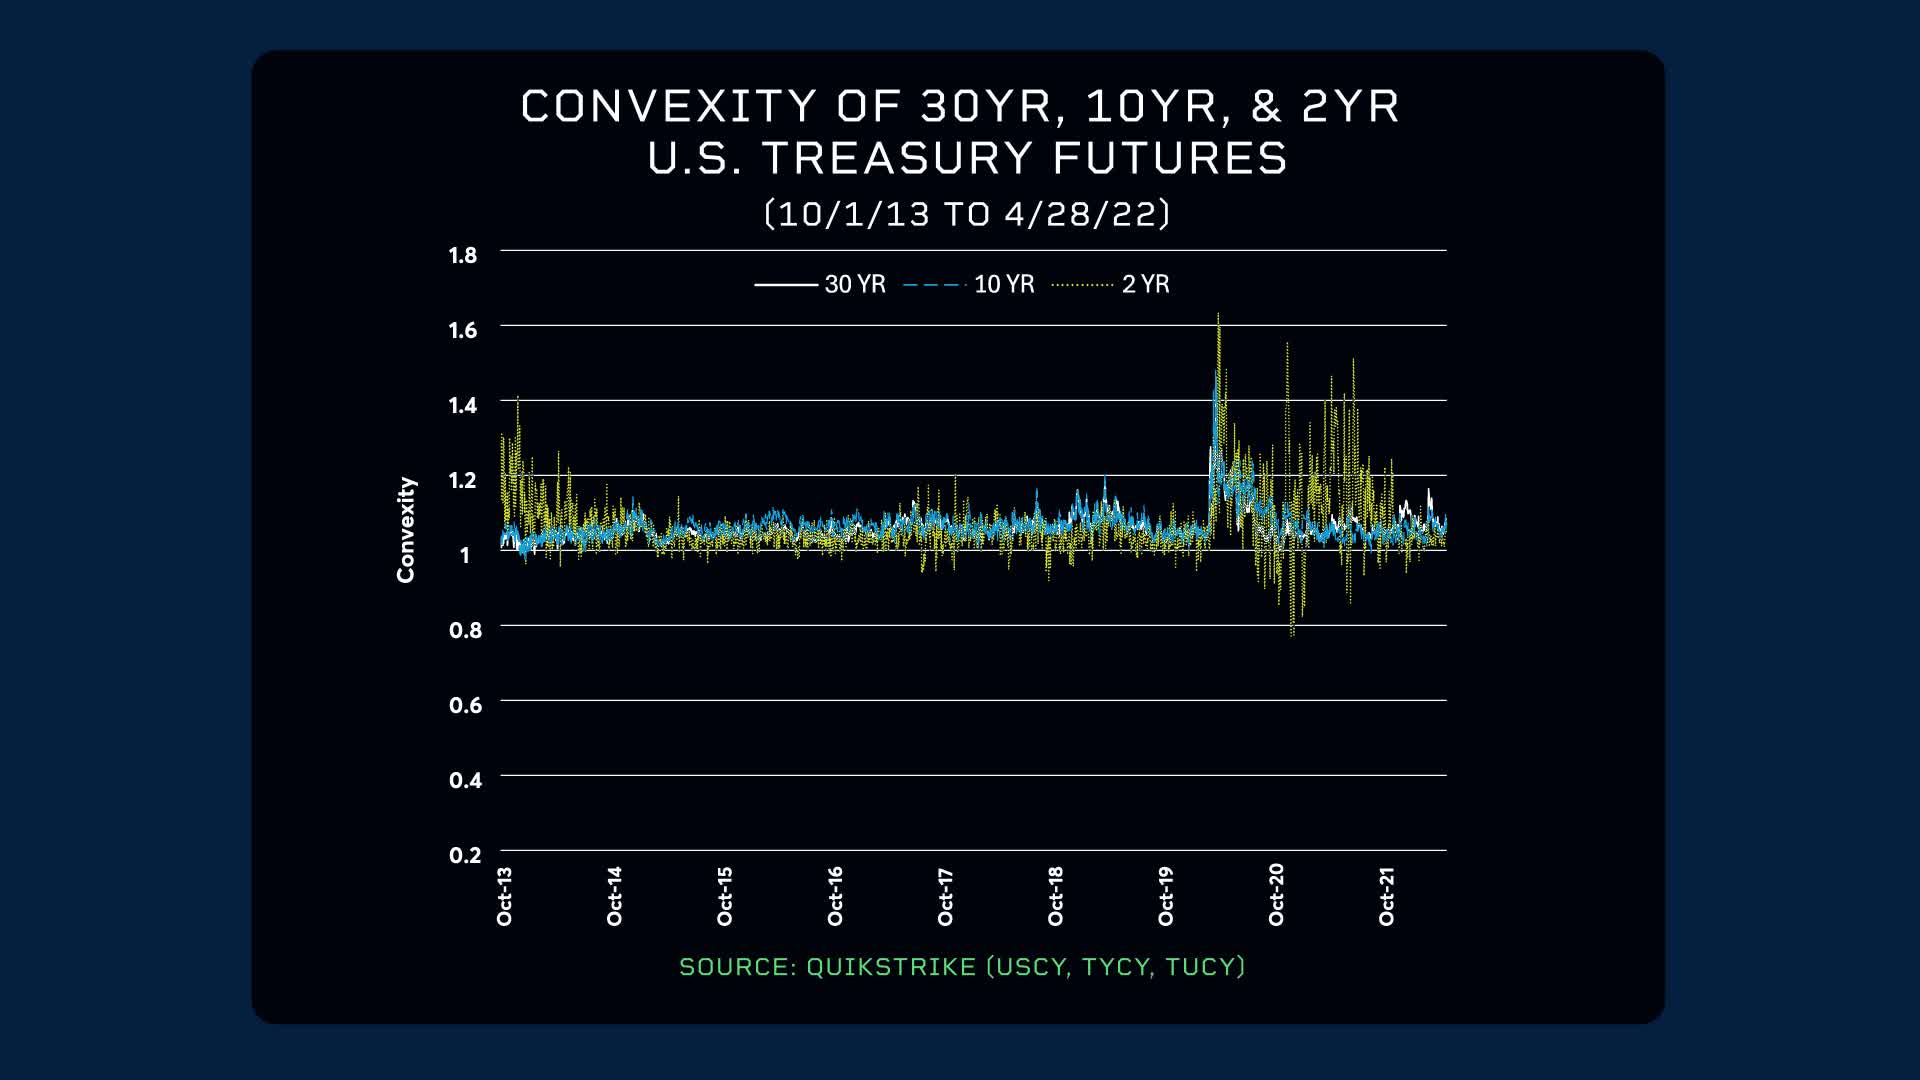
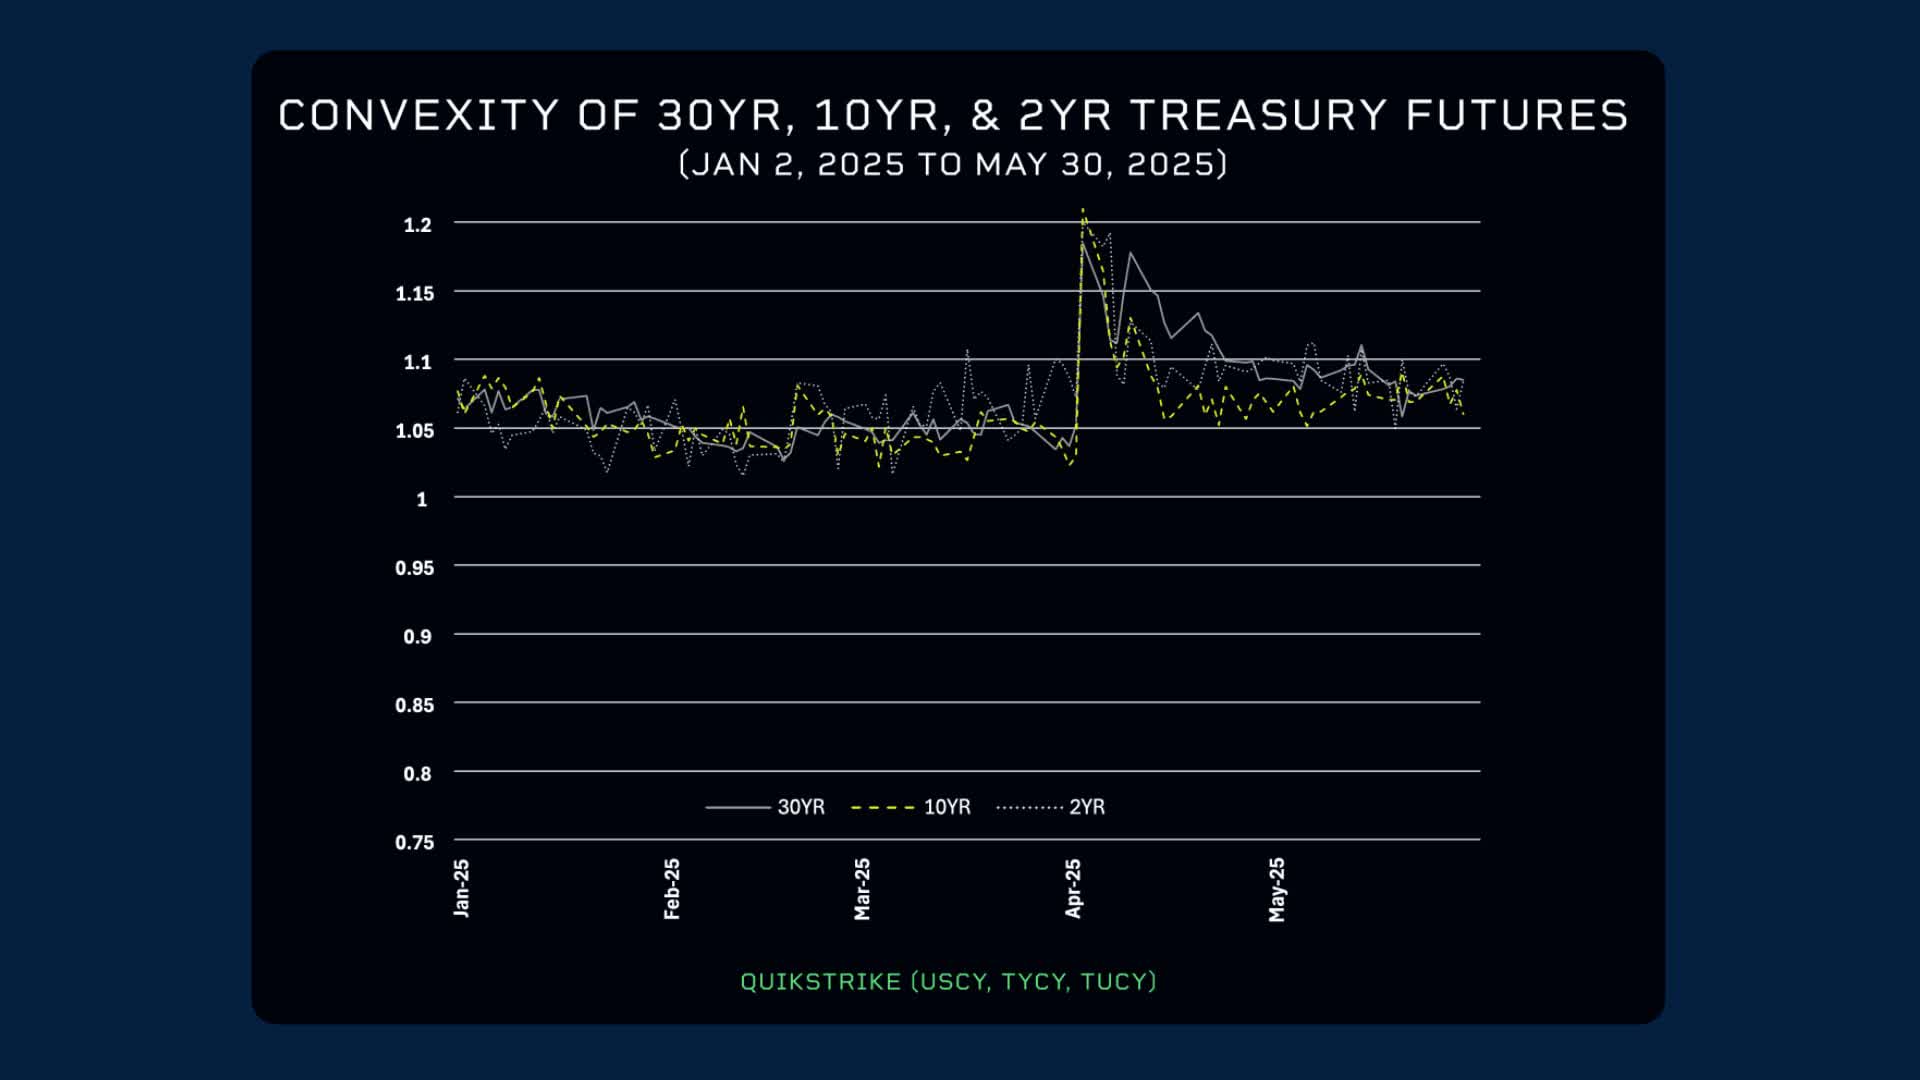
As of early 2025, convexity fluctuated around its historical average of 1.06. However, in April, changes in U.S. trade policies caused convexity and Treasury yields to spike. Since then, convexity has remained high, suggesting greater uncertainty in future Treasury yields. While 30-year convexity remains stable, two-year convexity is increasing, aligning with historical patterns.
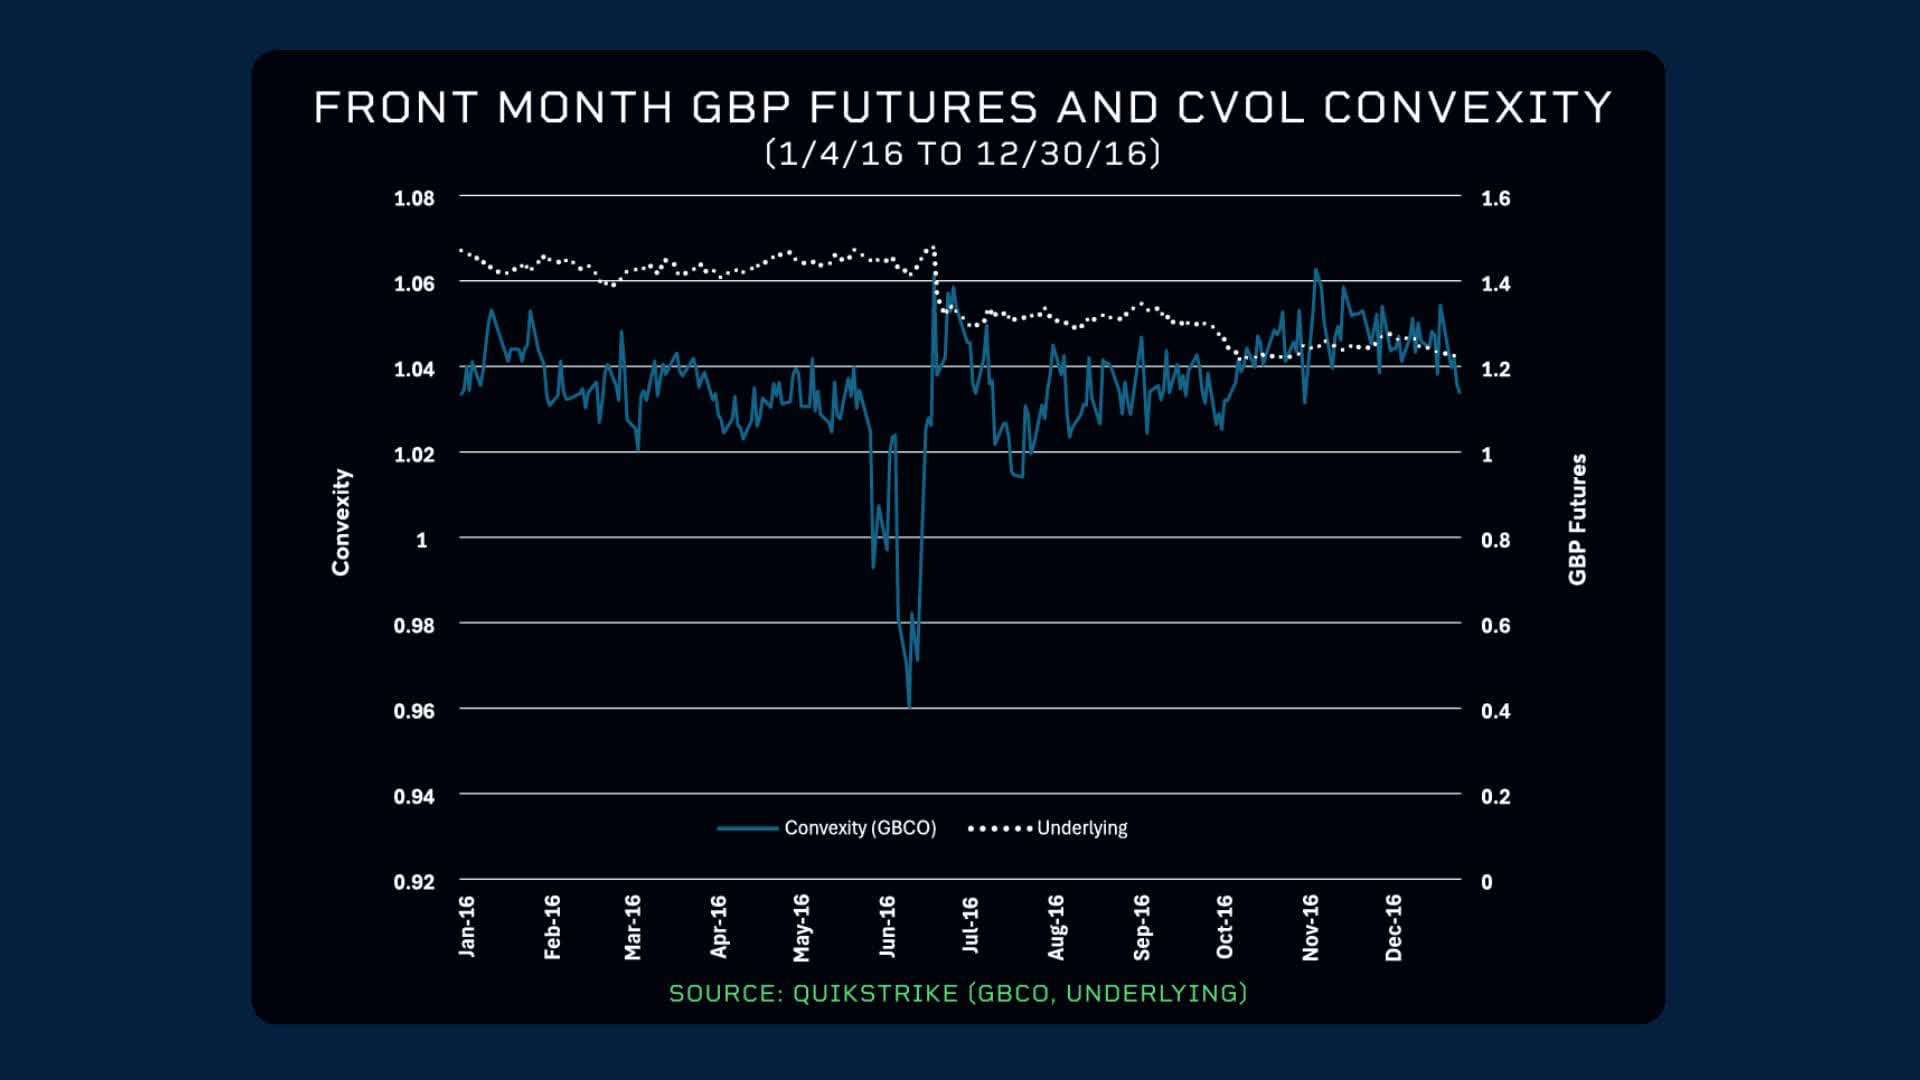
2. British Pound Futures
On June 23, 2016, the UK voted to leave the EU. Leading up to the referendum, the British Pound was relatively steady at around 1.43. However, convexity declined to a low of 0.96, indicating the market was focused on at-the-money strike prices. On the day of the vote, convexity spiked, showing increased uncertainty and more activity in out-of-the-money options.
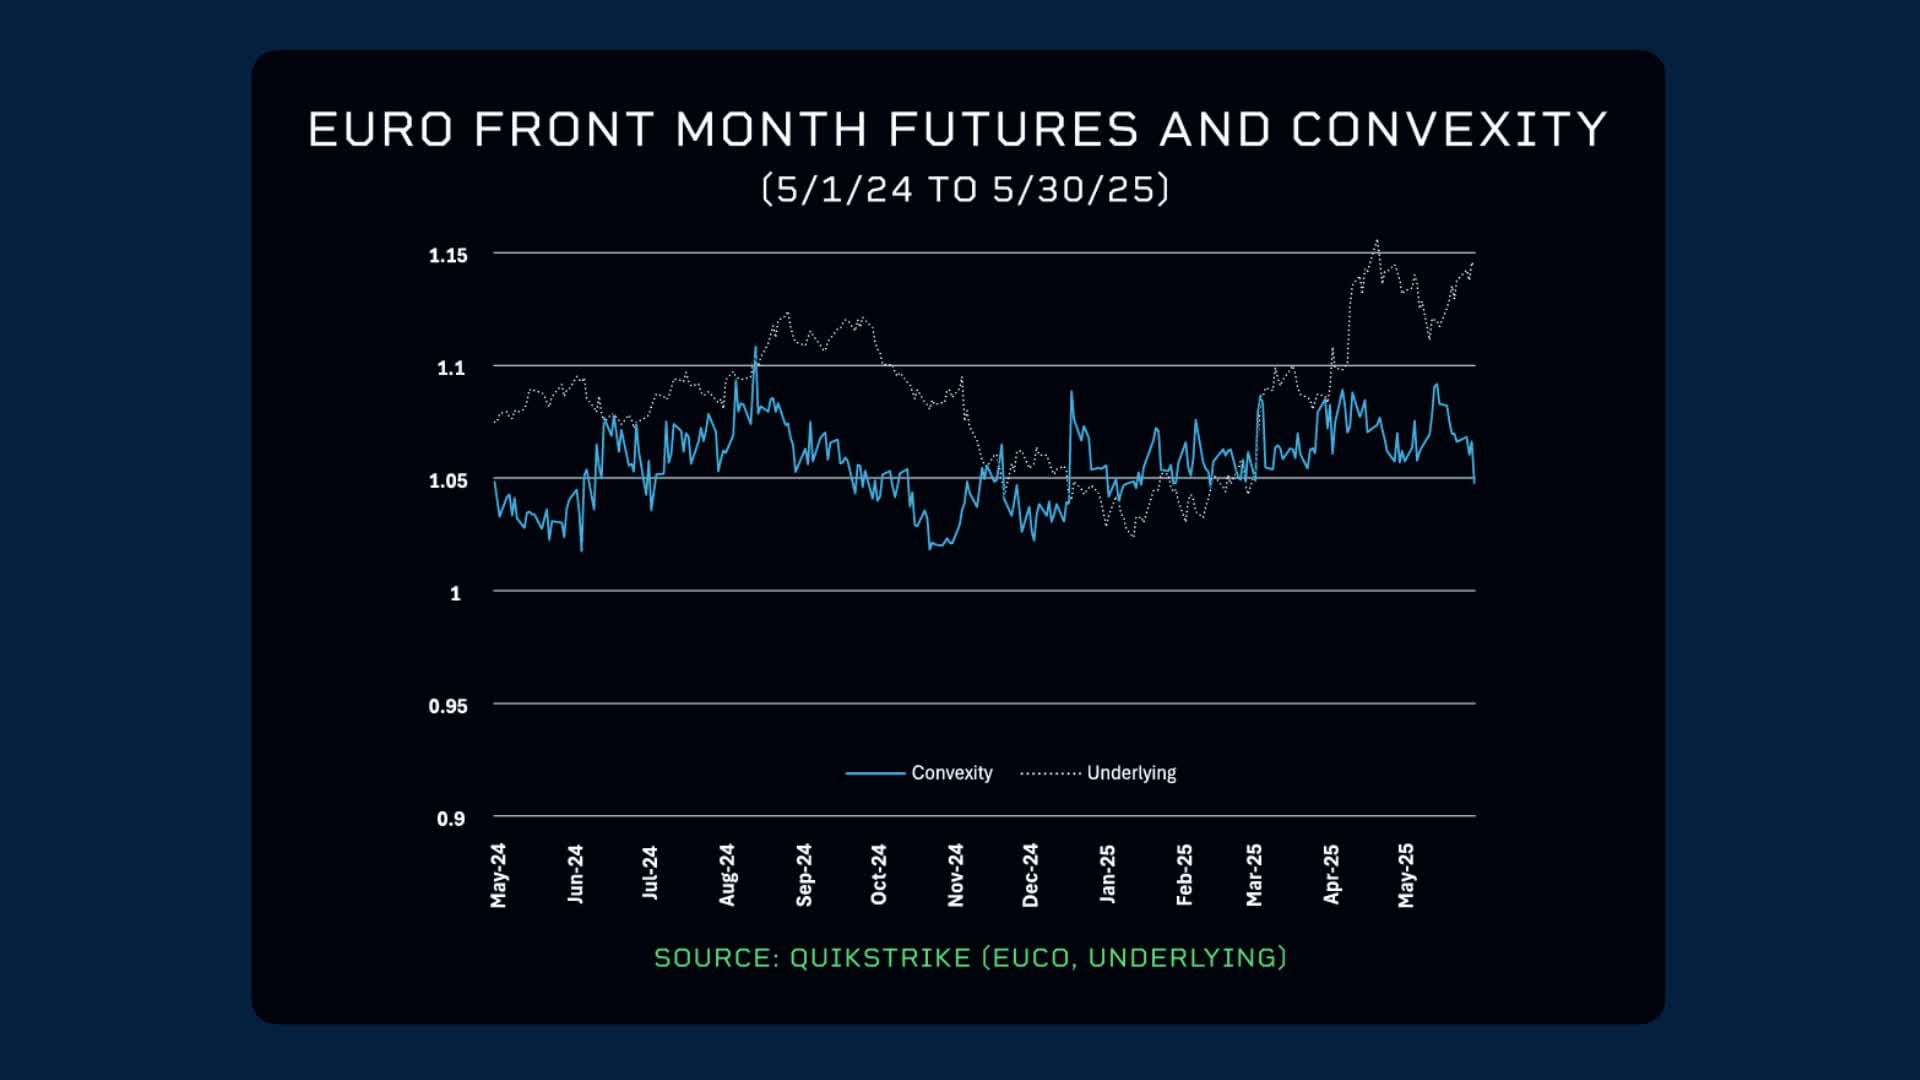
3. Euro Futures
Similarly, the convexity of Euro futures has been cycling around 1.05, its long-term mean and median since October 2013. In August 2024, convexity increased as the options market was uncertain about the Euro’s direction. As the Euro futures bottomed in January 2025, convexity initially spiked but has since reverted to the mean, suggesting the market perceives less uncertainty in the foreseeable future.
The next time you see CVOL convexity increase, consider what it might imply about market sentiment.
Editor’s Note: The summary bullets for this article were chosen by Seeking Alpha editors.