Ethics statement
Throughout this study, we took care to follow relevant ethical standards. The use of sock puppet accounts is an established research technique for investigating personalization and bias on internet platforms12,24,45, provided it is strictly for noncommercial, public-interest purposes and does not compromise user privacy. Previous work and legal precedent have indicated that the Terms of Service of social media platforms, which may prohibit automated access to content, do not necessarily conflict with collecting publicly available data for research aims46,47. Given our focus on potential impacts on democratic processes and political discourse, this project falls under well-recognized academic exceptions for studying online information ecosystems. Moreover, we minimized the risk of privacy breaches or commercial harm by restricting our data collection to publicly available content. Although the experiment itself did not include any human participants, we obtained informed consent from the human annotators for our LLM classification validation tasks.
For the survey component of this study, the survey was deemed exempt by the authors’ institutional review board (IRB protocol no. HRPP-2025-69).
Experimental setup
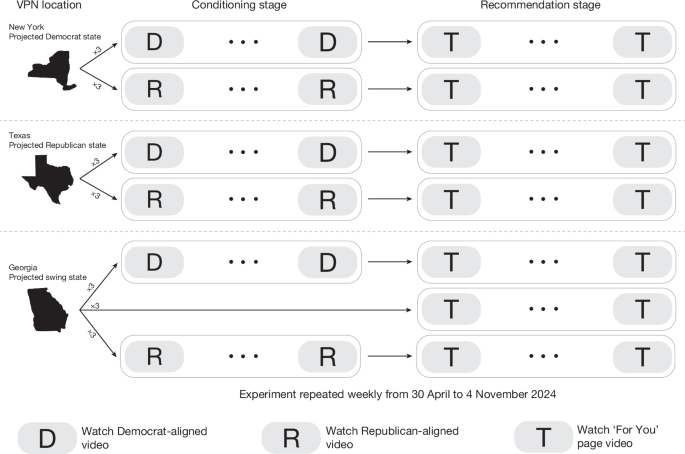
In this experiment, we aimed to measure the rate at which videos of a certain political leaning appear in the recommendations of TikTok, in the context of US politics. To do so, we use bots that simulate TikTok users by watching both predefined sequences of videos of a given political leaning (the ‘conditioning’ stage), and then subsequently watching recommended videos on ‘For You’ page (the ‘recommendation’ stage) of a given bot. Each experimental run, comprising these two stages, lasts for a 1-week period.
Over the duration of 27 weeks, 567 experiments were conducted. Specifically, each week, 21 new TikTok accounts are created by randomly combining the most common American first and last names from ref. 48 and assigning an age between 22 years and 24 years. This allowed each account to impersonate a potential voter for the US presidential election likely to be active on TikTok. This age range was also an intentional decision made to standardize the age of the user across experimental conditions. Moreover, our decision to select this age range was guided by data suggesting that the 18–24 years age bracket had the largest share of users on TikTok in the USA as of 2022 (35%), although the older 25–34 years age bracket now occupies the largest share as of late 2024 (ref. 49). The 21 accounts created each week are split into one of nine experimental conditions, which are defined by two attributes. The first attribute is the state to which the bot is manually geo-located, which is either New York, Texas or Georgia (Georgia was largely regarded as a key swing state for 2024 US presidential elections, with a narrow 0.23% margin in favour of Joe Biden in the previous 2020 elections). We chose New York, Texas and Georgia because, on the basis of the 2020 presidential results, they serve as clear prototypes of a reliably Democratic state, a reliably Republican state and a competitive swing state, respectively, in the 2024 electoral landscape. Practical constraints also shaped this choice, as only these three locations were simultaneously available and stable across our VPN infrastructure. Among the feasible options, they maximized geographic and partisan diversity, but we caution that our findings should not be presumed to generalize beyond these states. The second variable is the political leaning of the videos the bot watches in the conditioning stage. The videos watched in the conditioning stage are published by either known Democrat-supporting channels or Republican-supporting channels. Finally, each week, three bots geo-located to Georgia bypass the conditioning stage of the experiment and move directly to the recommendation stage. This is done to collect recommendations made to users who do not have a particular interest in politics. A summary of the experimental conditions is provided in Supplementary Table 2.
Supplementary Fig. 4 shows a more detailed timeline of a bot during a given experimental run. Although our original design contemplated a fully crossed 3 (State: New York, Texas, Georgia) × 3 (Partisan seed: Democrat, Republican, Neutral) structure, we ultimately implemented a reduced version with seven conditions. In particular, neutral-seeded accounts were deployed only in Georgia. This decision was driven by practical constraints: expanding to nine concurrent experimental conditions required more devices to run simultaneously, which increased the risk of detection and deactivation by the platform safeguards of TikTok. We prioritized the inclusion of a neutral baseline in Georgia, a prototypical swing state, given its strategic value for interpreting partisan effects in a politically heterogeneous context. Although this design does not allow for full within-state comparisons between neutral and partisan accounts in New York and Texas, we note this as a limitation and interpret state–partisanship interactions with appropriate caution.
Pre- and post-experiment protocols
TikTok infers user location through the GPS or network (IP) geo-location of the device50. This required us to dedicate an Android smartphone, namely, Samsung Galaxy A34 5G, to each of the 21 accounts created every week. Before each experiment, we controlled device geo-location across three target states using a combined approach of GPS mocking and VPN tunnelling. Specifically, we used AnyTo51 for GPS coordinate spoofing, setting New York bots to ⟨40.7308, −73.9976⟩ in Manhattan, New York City; Texas bots to ⟨33.148, −96.638⟩ in Collin County; and Georgia bots to ⟨33.961, −84.537⟩ in Cobb County. These specific locations were chosen as counties that voted strongly Democrat, Republican or were a close call in the 2020 US presidential elections, respectively. Furthermore, to align the network identity of each bot with the geo-location of the intended state, we tunnelled the public IP address of each phone to one of three custom VPN servers we hosted on third-party cloud providers. We avoided commercial VPN services to minimize the risk of TikTok identifying the IPs as virtual. We installed TikTok from Google Play Store only after the GPS and IP address of each phone had been appropriately modified. At the conclusion of a weekly experiment, we factory-reset every phone before beginning the next round of the experiment. This step ensures that any TikTok-related cache is cleared and does not influence the subsequent experiments conducted on the same phones. Finally, all phones operated on Android 13, which re-randomizes the MAC (medium access control) address every 24 h (ref. 52), precluding the possibility of device-level tracking or bot detection of TikTok throughout a weekly experiment.
Conditioning stage
In the conditioning stage of the experiment, bots watch a sequence of videos published by TikTok channels aligned with either Democratic or Republican political leanings. To collect the channels that the bots would watch in this stage, channels were compiled iteratively by searching for politically charged keywords, such as ‘Trump’, ‘Biden’ or ‘Kamala’ on the search bar of TikTok, apart from the terms ‘Democrat’ and ‘Republican’. From there, the channels published videos supporting each candidate were compiled and verified by the authors to fit the following criteria: (1) most of the videos published by the channel concern political content; and (2) all the political videos published by the channel are aligned with either the Democratic or Republican political parties.
In total, 54 candidate channels were compiled across both political party affiliations. Each channel associated with a given political party was then matched with a channel from the opposite political party based on its number of followers and cumulative number of likes using Euclidean distance matching. This was done to account for the possibility that the strength of the political conditioning of a given bot may be partially attributed to the popularity of the channels it watches in the conditioning stage. After matching, the 10 pairs of channels with the smallest Euclidean distance were selected. Supplementary Table 36 details the channels used in the conditioning stage, showing 12 pairs in total, as two channels (donaldtrumpwasright and kayetriots) became no longer available (deleted or made private) during our experiments. As such, those two pairs were replaced with the new pairs that had the smallest Euclidean distance. The accounts of the main political candidates (kamalaharris and realdonaldtrump) did not exist when the experiment began in May, and hence, were not included as conditioning channels. Kamala Harris officially joined TikTok in July, whereas Donald Trump joined the platform in June.
In each experiment, a bot is conditioned to lean either Democratic or Republican by watching up to 50 most recent videos from eight randomly selected channels aligned with the respective political party. The target of each bot watching 400 conditioning videos in total was not always achieved, as shown in Supplementary Table 37. On average, Republican bots viewed fewer conditioning videos because of several of the Republican accounts having fewer than 50 total published videos, particularly during the first few months of the experiment. To account for this, the number of videos watched during the conditioning stage was controlled for during all analyses that compared recommendation rates across experimental conditions. Every video during the conditioning stage was watched for 1 min, ensuring consistent exposure to the content from the selected channels. After completing the predefined set of videos, the bot would then ‘sleep’ for 24 h, during which it would not open or interact with TikTok. This pause was implemented to simulate realistic human viewing patterns, minimizing the risk of bot detection that could result from consuming an excessive number of videos in rapid succession.
Recommendation stage
Following the conditioning stage, each bot in the experiment transitions to the recommendation stage, in which they watch videos that appear on their For You page. The For You page is the default interface on TikTok, in which users can watch videos recommended to them based on their interests as implicitly determined by the algorithm of TikTok. In this stage, each video is watched for up to 10 s, after which the URL of the video is retrieved. To circumvent the bot detection mechanism of TikTok, only the first 10 recommended videos were watched per hour, followed by a 60-min sleep. Moreover, the TikTok app was reloaded before every hourly session to avoid watching videos preloaded during the previous iteration.
All URLs collected in a given experimental run are then used to retrieve the metadata of the video, including the author of the video, the description of the video and its embedded transcript, if available. Of the 176,252 unique videos watched, 40,264 had a transcript available, and it is this set of 40,264 videos that we analyse in the remainder of this study. In the ‘Data Representativeness’ section, we show that this sample is representative of the entire dataset of recommended videos.
Experimental run validation
Naturally, with audit experiments such as this one, experimental failures are inevitable because of issues such TikTok classifying the account as a bot and subsequently suspending the account, or internet outages. As such, to ensure the same amount of recommendation exposure for Democrat- and Republican-conditioned bots, we match bots of opposite conditioning in each state during a given experiment week. Consequently, for each pair of bots, we only consider the first n recommendations made to each bot, where n is the lesser of the total number of recommendations made to either bot. Furthermore, we only consider pairs of bots that watched at least 150 videos each. This threshold is a deviation from our preregistration, which set the threshold at 500, because of our initial overestimation of the number of videos bots would watch during a given experimental run.
There were a handful of weeks in which the bots failed to meet our inclusion threshold. First, at the end of July and the beginning of August, bots with a Texas geo-location lost internet connectivity while the authors were not available to tend to the bots. As such, we were unable to collect data from Texas during this time. In another week, some accounts were recognized as bots by the bot detection algorithm of TikTok and subsequently suspended before reaching the threshold of 150 videos. Of the 567 experiments conducted, 323 met our inclusion criteria. Supplementary Table 3 lists the total number of bots that met the inclusion criteria on a weekly basis across the different bot conditioning and geo-location classes.
Ideological stance classification
To analyse the ideological stances present in the video content, we implemented a three-step classification approach using an ensemble of LLMs comprising GPT-4o, Gemini Pro and GPT-4. First, each video transcript was evaluated for political content using the prompt: ‘Given the following video transcript, do you think the topic is political?’
For transcripts identified as political, we conducted two additional classification steps. The first assessed election relevance through the prompt ‘Given the following video transcript, do you think the topic is related to the 2024 US election or related to Donald Trump, Kamala Harris, Joe Biden, JD Vance, or Tim Walz? Answer with only Yes or No’.
The second step determined the partisan stance using the prompt ‘Given the following video transcript, classify the transcript into one of the following categories:
Anti Democrat
Anti Republican
Pro Democrat
Pro Republican
Neutral’.
The distribution of classifications across these categories is presented in Supplementary Table 11.
Throughout our study, we often group the categories ‘Anti-Democrat’ and ‘Pro-Republican’ under the broad category of ‘Republican-aligned’, and similarly group the categories ‘Anti-Republican’ and ‘Pro-Democrat’ under the category of ‘Democrat-aligned’.
To ensure classification reliability, we used a consensus-based approach in which GPT-4 served as the tiebreaker in cases of disagreement between GPT-4o and Gemini Pro. The inter-model agreement rates for each classification task are detailed in Supplementary Table 7. This ensemble method was chosen to mitigate individual model biases and enhance the robustness of our ideological stance classifications.
Finally, after all videos had been classified, we excluded the 10 advertisement videos encountered by the bots during the entire duration of the experiment, which were labelled as political. Of these, only one had a non-neutral ideological stance (‘Anti-Democrat’). Furthermore, none of the 10 advertisements was published by an official political candidate channel.
Ideological stance validation
To validate our automated classification approach, we conducted a human annotation study on a subset of 500 randomly selected transcripts. Three independent annotators, all political science undergraduate students, were recruited to perform the classification tasks. The annotators were permitted to use web searches to research unfamiliar topics or references within the transcripts, ensuring informed labelling decisions. Each transcript received independent classifications from all three annotators following the same categorical framework used in the LLM classification. The results of this validation study, including inter-rater reliability metrics, human majority–LLM majority classification accuracy, Cohen’s κ coefficient comparing human-majority and LLM-majority decisions, and the F1 scores of the LLM ensemble, are presented in Supplementary Table 8, whereas Supplementary Table 9 details these scores for each model separately.
Channel classification
To identify channels potentially leaning towards either the Democratic or Republican ideologies, we focused on channels that had published videos previously labelled with a specific non-neutral ideological stance (for example, ‘Anti-Democrat’, ‘Pro-Republican’, ‘Anti-Republican’ or ‘Pro-Democrat’). From this process, we identified 170 unique channels for analysis. For each channel, we calculated the proportion of videos aligned with the ideology of a particular party as a fraction of the total videos collected for that channel. To ensure robustness in our classification, channels were labelled as Democrat-aligned or Republican-aligned if more than 75% of their analysed videos were ideologically consistent with one party. For 85 channels with fewer than 10 unique videos collected during the experiment phase, we used TikAPI (https://tikapi.io/) to retrieve up to 30 additional videos published before the election. These additional videos were processed through the same transcript classification pipeline to determine their ideological stance. This step was necessary to avoid potential misclassification caused by the unique videos watched by the bots of a limited number of channels. Supplementary Table 38 presents a summary of the classified channels, including the total number of channels in each category (Republican-aligned, Democrat-aligned and Neutral) as well as the average proportion of partisan content for each group. Finally, we validated our 75% threshold by examining 13 channels falling between 60% and 75% alignment, which predominantly comprised traditional news outlets (Daily Mail, USA TODAY and Channel 4), talk shows (The Daily Show, Don Lemon and The Problem With Jon Stewart), and journalistic content that often covers political topics while maintaining some editorial balance. This distribution confirms that the 75% threshold effectively distinguished consistently partisan channels from those with occasional political lean (see Supplementary Table 5 for a list of channels that did not meet the 75% threshold).
Comment classification and asymmetric homophily
To identify the ideological stance of the comments on a given TikTok video, we follow a similar methodology to that of classifying a video. Specifically, we pass both the transcript of the video and the comment in question in a prompt to GPT-4o, which can be seen below: ‘Given the following TikTok video transcript and comment, classify the comment into one of the following categories.
Transcript of the video: TRANSCRIPT
Comment: COMMENT
Categories:
Anti Democrat
Anti Republican
Pro Democrat
Pro Republican
Neutral’.
The outputs of the model were validated by three independent annotators, again, all political science undergraduate students. The results of this validation process are shown in Supplementary Table 10.
To examine whether cross-party engagement patterns (‘asymmetric homophily’) could explain the observed skew seen in Fig. 2d–f, we analyse the partisan composition of comments on political videos. The key hypothesis is that, if Democrats systematically engage more with Republican-aligned videos than Republicans engage with Democratic-aligned videos, Republican-aligned videos that attract more Democratic-engaged comments should in turn be recommended more often to Democratic bots.
Specifically, we collect a random sample of 500 comments from all political videos examined in our study and classify the content of each comment in the context of that video. From this, we compute the proportion of comments ideologically aligned with the video. We find meaningful differences between Republican-aligned and Democratic-aligned videos in the composition of comments, but not in the expected direction. We find that Democratic-aligned videos have a nominally higher proportion of Republican-aligned comments than vice versa, although this difference is not statistically significant (12.9% compared with 8.5%; two-sided χ2 = 2.32, P = 0.13). Democratic-aligned videos also have a nominally higher proportion of co-partisan comments than Republican-aligned videos, again without reaching statistical significance (63.1% compared with 51.6%; two-sided χ2 = 1.97, P = 0.16). However, Republican-aligned videos have a significantly higher proportion of ‘neutral’ comments that are not explicitly partisan (44.6% compared with 26.3%; two-sided χ2 = 7.53, P = 0.006). We also include this metric in our weighted sampling robustness check (Fig. 2g), finding similar results to our other observed engagement metrics.
Conditioning stage validation
We take several steps to validate that the seeding delivered to bots of opposite party alignments was equivalent. A summary of this analysis is presented in Extended Data Fig. 1. First, we evaluate the proportion of videos directly related to the US election or major political figures (as determined by the second question of the transcript classification pipeline described above). As shown in Extended Data Fig. 1a, we find that Democratic-aligned and Republican-aligned bots were exposed to a statistically similar proportion of election-related videos (two-sided independent t-tests; t = −0.478, P = 1.0).
Regarding positive and negative partisanship, although we find no statistically significant differences between the two bot groups (two-sided independent t-tests; positive partisanship: t = 2.19, P = 0.129; negative partisanship: t = −1.7, P = 0.373; and neutral: t = 1.63, P = 0.426), we do nonetheless see a modest asymmetry, in which the Republican seed set contained more anti-Democratic than pro-Republican content, whereas the Democratic seed set was comparatively balanced. Although this difference was not statistically significant, it is nonetheless important to acknowledge. This asymmetry does not reflect an intentional experimental design choice. Rather, it reflects the supply of content from the accounts selected for seeding, in which anti-Democratic videos were marginally more prevalent among the chosen Republican-aligned creators than anti-Republican videos were among the chosen Democratic-aligned creators.
To assess whether this difference had downstream effects on the proportion of negative partisanship videos seen during the recommendation stage, we model the likelihood of a recommended video being of negative partisanship as a function of the proportion of these videos seen during the conditioning stage of a bot. We find that it is neither the conditioning of the bot nor the proportion of negative partisanship videos seen in the conditioning stage that significantly predicts a recommended video being of negative partisanship. Rather, it is the characteristics of the author of the video (their follower count and total share count), as well as the normalized number of comments the video receives that are significant, suggesting that the gap in negative partisanship recommendations is due to supply-side factors rather than factors in our control in the conditioning stage (Supplementary Fig. 10). Nonetheless, we recognize that this imbalance could contribute, at least partially, to the asymmetric outcomes we observe, and we highlight this as a limitation of our design.
Second, we classify a random sample of up to 500 comments posted under each of the partisan videos seen during the conditioning stage, using the comment classification procedure described in the previous section. As shown in Extended Data Fig. 1b, videos shown to Democratic- and Republican-aligned bots received similar rates of both party-aligned and opposite-party-aligned comments (party-aligned comments: 60.2% compared with 59.9%, two-sided χ2 = 0.008, P = 0.925; opposite party-aligned comments: 8.9% compared with 6.8%, two-sided χ2 = 0.18, P = 0.67).
Third, we compute the embedding of the transcripts of all videos within our dataset using the embedding model proposed in ref. 53, chosen as an open-source embedding model with performance on par with state-of-the-art models. We then compute the centroids of the sets of videos seen by Democratic-aligned and Republican-aligned bots during the conditioning stage of their respective audits. The projection of these cluster centroids into two dimensions using principal component analysis (PCA) is shown in Extended Data Fig. 1c. To better understand the extent to which the sets of videos diverge semantically across partisan conditions, we compute the axis of maximal variation between Democratic and Republican videos by taking the unit vector connecting their respective centroids in the original embedding space. We then project the corresponding centroids onto this axis, allowing us to quantify and visualize partisan separation in semantic space. This approach enables us to assess whether the videos shown to Democratic- and Republican-aligned accounts are meaningfully distinct in content, or whether they largely occupy overlapping regions of the embedding space. As shown in Extended Data Fig. 1d, the cluster centroids of conditioning-stage videos seen by Democratic-aligned and Republican-aligned bots were approximately equidistant from the centroid of neutral videos, both in terms of their projected positions along the axis of maximal variation (0.05 compared with 0.032), as well as the average Euclidean distance between the individual videos belonging to that cluster and the neutral centroid in the original high-dimensional embedding space (0.446 compared with 0.443, t = 1.962, P = 0.05).
Taken together, these analyses suggest that the seeding videos shown to Democratic- and Republican-aligned bots were largely equivalent in both content and semantic distribution. Across multiple validation checks, including election relevance, partisanship framing, audience partisanship in the form of comments and transcript-level semantic similarity, we find little to no consistent evidence of systematic differences between the two groups. This is apart from the pre-seeding matching steps taken to ensure that videos were selected from channels of a similar overall popularity.
Cross-partisan recommendation regression model
We further formalize the robustness analyses using a linear probability model (LPM) at the bot-video recommendation level. The dependent variable Yib is an indicator that video i recommended to bot b is a cross-partisan recommendation, defined as a recommendation in which the partisan alignment of the video does not match the conditioned partisanship of the bot. The key independent variable is an indicator for whether bot b was conditioned on Democratic compared with Republican content.
The baseline specification is
$${Y}_{ib}=\alpha +\beta {{\rm{D}}{\rm{e}}{\rm{m}}{\rm{B}}{\rm{o}}{\rm{t}}}_{b}+{\gamma }^{{\prime} }{X}_{ib}+{\delta }_{b}+{\lambda }_{w}+{{\varepsilon }}_{ib},$$
where DemBotb equals 1 for Democratic-conditioned bots and 0 for Republican-conditioned bots, Xib is a vector of covariates, α is the intercept, β is the coefficient on the Democratic conditioning indicator (the parameter of primary interest), γ′ is a vector of coefficients on the covariates Xib, δb are bot fixed effects, λw are week fixed effects and εib is the error term. The covariate vector Xib includes the number of videos watched by the bot during its experimental run, the proportion of recommended videos with transcripts, and a set of video- and channel-level engagement measures for both conditioning-stage and recommendation-stage videos (for example, likes, comments, plays, share count, follower count and verification status). We estimate the model using OLS with two-way cluster-robust standard errors by bot and week to account for within-bot and within-week dependence in recommendations.
Because many engagement covariates are highly correlated, we assess multicollinearity using variance inflation factors (VIFs). Independent variables with VIF values greater than five are combined into a lower-dimensional index using PCA; in particular, we summarize conditioning-stage video- and channel-level engagement variables into a single combined engagement score used as a control in the regression. Supplementary Tables 20 and 21 report the VIF scores for all covariates.
For ease of interpretation, the main-text regression figures report results from LPMs, whose coefficients can be read directly as percentage-point changes in the outcome (Supplementary Tables 22, 24 and 26). To assess robustness to functional-form assumptions, we also estimate the same specifications using logistic regression and report these results in Supplementary Tables 23, 25 and 27. Across all models, the sign and substantive significance of the key coefficients are largely similar in the logit and LPM specifications.
Given the large number of coefficients tested across related models, we adjust for multiple comparisons using Benjamini–Hochberg (BH) corrections, which control the false discovery rate. We report both unadjusted and BH-adjusted P values in Supplementary Tables 22–27, and use BH-adjusted P values as the basis for statistical significance markers in Fig. 3e and Supplementary Fig. 1b.
Sensitivity analysis
Although we have shown evidence that observable engagement metrics and viewership patterns cannot explain the ideological skew in Republican-aligned content on TikTok, we cannot rule out the possibility that there are unobserved or latent engagement metrics or viewership patterns, known to the TikTok algorithm but unknown to us, that would explain the gap we observe. For instance, a key engagement metric such as ‘dwell time’, or how long a user spends watching a particular video, is not a publicly available metric published by TikTok. As such, we conduct a sensitivity analysis to calculate how strong such an unobserved factor would have to be to fully explain the apparent ideological skew of TikTok.
In Supplementary Table 39, we show in the first column the true difference between the Republican and Democratic videos with regard to their normalized values for a given engagement metric. In the remaining four columns, we show the ratio between the difference needed to match the observed skew and that of the true difference in mean between Republican and Democratic videos in a given engagement metric. As can be seen, for most of the engagement metrics, it is Democratic videos that tend to have higher engagement on average, with the exceptions being in the video comment count, such as count, play count, share count and composite score. Although the combination of these metrics produces the largest normalized Republican skew in engagement gap, this gap would need to be 9.4 times as large to fully explain the observed skew in recommendation rates seen in our experiments.
Data representativeness
Given that our primary analysis throughout this study focuses on videos with transcripts, we must ensure that this sample is representative of videos throughout the entire dataset. To do so, we annotate a random sample of videos recommended to each of the sets of Republicans and Democrats during the experiment. Specifically, for each of these sets, we analyse a random sample of 2,000 videos that do not include transcripts to measure the following features of a given video: (1) whether the video is political in nature; (2) whether the video is concerned with the 2024 US elections or major US political figures; and (3) the ideological stance of the video in question (Pro Democrat, Anti Democrat, Pro Republican, Anti Republican or Neutral). This annotation task was again completed by three political science undergraduates, with high agreement between annotators (Krippendorf’s α; Q1: α = 0.858, Q2: α = 1.0, Q3: α = 0.989). We find that the inter-rater agreement when viewing the videos directly, rather than relying on the transcript alone (the results of which are in Supplementary Table 7), yielded higher agreement between the raters.
This process allows us to compare the distribution of political content in videos with transcripts against those without transcripts. The results of this comparison are shown in Extended Data Fig. 2. As can be seen, videos with no transcripts contained significantly fewer political videos on average relative to those that did include transcripts. This result is perhaps unsurprising given that videos that do not include a transcript are also less likely to include dialogue (for example, videos of landscapes or pets). However, of those that were political, we do not find significant differences (computed through χ2 tests) between transcript and non-transcript videos with regard to the proportion of political videos about the election, nor their distribution of Democrat-aligned, Republican-aligned or Neutral videos.
Topic analysis
To identify the topics discussed in each political video, we use the methodology used in ref. 54. Specifically, the authors used GPT-4 to classify a video in one of a set of topics, and thoroughly validated their approach, finding accuracies greater than 0.9 for all topics.
We slightly modify the prompt used in ref. 54 to allow the LLM to select more than one topic option. The prompt used can be seen below:
You are an AI assistant trained to look at social media posts and determine what the post is about.
You will receive the transcript of the video in question.
You will be given a list of topics. Please tell us what this post is about.
Transcript: [TRANSCRIPT]
Some other things to keep in mind:
-
There is an election in November, so many posts will be about that. The Democratic candidates were Joe Biden and Kamala Harris, but Joe Biden dropped out and it’s Kamala Harris and Tim Walz. The Republican candidates are Donald Trump and JD Vance. The independent candidates are Robert F Kennedy Jr (RFK Jr), Cornel West, and Jill Stein.
-
If there are multiple topics, pick all the relevant topics.
-
If a post seems political, first see if it goes into another category. For example a post about politics and race would go into the race category. Fall back on politics if none other fits, as long as there is something political.
-
With the exception of immigration, most posts that reference a foreign country will go into the last category.
Categories:
-
1.
Crime
-
1.1.
Crime generally
-
1.1.
-
2.
Environment
-
2.1.
Climate change
-
2.2.
Other environmental issues
-
2.1.
-
3.
Immigration
-
3.1.
Immigration generally
-
3.1.
-
4.
Social issues
-
4.1.
Abortion and reproductive health
-
4.2.
Guns and gun control
-
4.3.
LGBTQ+ issues, including transgender issues
-
4.4.
Racial issues, including affirmative action and racial discrimination
-
4.5.
Education
-
4.6.
Other social issues, including culture war issues, labor, and other social issues that are not covered above
-
4.1.
-
5.
Public health
-
5.1.
Covid, including covid vaccines
-
5.2.
Other vaccines
-
5.3.
Other public health issues
-
5.1.
-
6.
Economy
-
6.1.
Economy generally
-
6.1.
-
7.
Technology
-
7.1.
AI, LLMs
-
7.2.
Crypto
-
7.3.
Other technology issues
-
7.1.
-
8.
Government, politics and elections
-
8.1.
Assassination attempt on Donald Trump
-
8.2.
Republican National Convention (RNC)
-
8.3.
Democratic National Convention (DNC)
-
8.4.
Biden dropping out of the presidential race
-
8.5.
Other political or government related posts that do not fit into other categories
-
8.1.
-
9.
International issues
-
9.1.
Israel, Gaza or Palestine, including anything about Netanyahu or Hamas
-
9.2.
Ukraine war
-
9.3.
Anything outside the US or involve US foreign relations except for Israel, Gaza, Ukraine, or immigration
-
9.1.
-
10.
No topic
-
10.1.
None of the above topics
-
10.1.
Using the above prompt, the topics discussed in the 7,767 ideologically stanced TikTok videos in our dataset were identified. Supplementary Table 40 describes the number of videos falling under each category, split by the ideological stance of the video.
Video recommendation counterfactual models
To verify that the Republican skew observed in our experiments is not simply due to differences in the engagement metrics of Republican- and Democratic-aligned videos or channels, we build a series of counterfactual models to predict expected video recommendations based on these engagement metrics. Specifically, we aim to compute the ideological content that would arise if recommendations were driven purely by observable engagement, and then compare these expected skews to the ideological skew we actually observe in the feeds of the bots. As in the main text, we define the ideological content of a set of recommendations as the proportion of Republican-aligned videos minus the proportion of Democratic-aligned videos.
The metrics of interest include several video-level metrics, such as the number of plays or views a video receives, as well as its number of shares, comments and likes. Apart from video-level metrics, we also collect channel-level metrics such as the cumulative number of likes, followers and videos of a channel, as well as whether the channel is verified or not. Given that channel verification status is a binary attribute (True or False), we apply a value of 0.1 to channels that are not verified, and 0.9 to channels that are verified. For robustness, we also test all values between 0.5 and 1.0 in increments of 0.05 for verified channels (and inversely, 0.5 to 0 for unverified channels), and find similar results (Supplementary Table 17).
To retrieve predicted recommendation rates, for each week throughout the duration of the experiment we first isolate the set of videos seen by the bots during and before the week in question. We then compute normalized values of the metric in question using min–max normalization. Next, we compute a bootstrapped measure of expected ideological content by sampling n videos (where n is equivalent to the number of videos seen by a bot during a given week), weighted by the normalized metric in question. From each such sample, we compute the proportion of Republican-aligned and Democratic-aligned videos and take the difference to obtain the counterfactual ideological content for that draw. This allows us to compare the ideological content of the sampled recommendations to the ideological content actually observed in the feeds of the bots for the same state–week–condition cells. The sampling process is repeated 100 times for robustness to retrieve the mean and standard error of the expected ideological content per week for each set of partisan bots.
Apart from the single-value metrics mentioned above, we compute three additional engagement indices. The first is a linear combination of the normalized play, share, like and comment counts of a video. The second is a linear combination of the cumulative likes, followers and videos of a channel, as well as its verification status. The third is a linear combination of all video- and channel-level metrics. For each of these additional metrics, the weight of each component is derived using PCA, which identifies the linear combination of components that captures the maximum variance in the data. We use the loadings (coefficients) from the first principal component as weights, normalizing them to sum to 1, and repeat the sampling process described above for each of these three combined metrics.
The models that consider the number of likes or comments disregard the fact that these metrics are not independent of the recommendation algorithm. Videos that receive more recommendations end up being viewed more, which in turn increases their likelihood of receiving likes and/or comments. Thus, to develop counterfactual models that capture the intrinsic ‘quality’ of a video while partially isolating the effect of the algorithm, we normalize these metrics as follows. First, we take the number of ‘recommendations’ a video receives as the number of plays minus the number of shares. This subtraction yields the number of views received by the video, specifically by the recommendation algorithm, and not by users sharing the video. With this recommendations metric, we additionally develop counterfactual models that account for the number of likes or comments per recommendation of a video.
Finally, for each of the aforementioned metrics, we repeat the sampling processes while taking into account the potential favourability of recent content. Specifically, we inversely scale each metric in question with the time between when an audit was conducted and the publishing date of a given video, once linearly and once exponentially. In total, this amounts to 39 different counterfactual models with which we compare observed ideological content and expected ideological content. In Supplementary Fig. 1a, the leftmost point represents the observed ideological skew in the recommendations of the bots (the proportion of Republican-aligned videos minus the proportion of Democratic-aligned ones). Each of the remaining points presents the expected ideological skew as computed by the counterfactual models, with point markers indicating alternative recency-weighting schemes. If the observed engagement metrics fully explained the partisan gap, we would expect these engagement-based counterfactual skews to be close to the observed skew of approximately 0.2. Instead, across all 39 counterfactuals, the observed skew towards Republican-aligned content substantially exceeds the counterfactual skews, and many engagement-based models imply a Democratic-leaning skew. Supplementary Table 14 details the ideological skew computed by each model, as well as t-test results comparing the observed and expected skews. Supplementary Tables 15 and 16 report analogous results for models using only positive or only negative partisan videos, respectively.
Survey
We administered a preregistered survey with a sample of 1,008 US-based TikTok users to assess whether individuals had noticed changes to the content of their TikTok feeds, particularly political content, over the past year. The survey was preregistered on OSF (https://osf.io/udywb/) and was deemed exempt by the institutional review board of the authors (IRB protocol no. HRPP-2025-69).
Participants were recruited using the online platform Prolific and screened to ensure they resided in the USA and were active users of TikTok. The survey consisted of two parts: (1) a series of open-ended text-entry questions; and (2) a series of structured, scale-based questions. Open-ended items asked participants whether they had noticed any changes to the content on their TikTok feed in general, any changes to political content specifically and whether the tone of political content had become more positive or negative. Responses to these questions were manually coded by the first author to determine whether participants explicitly referenced changes to political content and, if so, whether they described seeing more Republican-aligned or Democratic-aligned content.
Structured questions asked participants to rate, on a 0–10 scale, the extent to which their feed had shifted towards Democratic or Republican content, become more positive or negative in tone, or featured more political content they agreed or disagreed with.
For each survey item, we conducted separate linear regression analyses that included participant political affiliation and demographic covariates (age, gender, race and education level) as predictors. Full regression results are presented in Supplementary Tables 33 and 34 for the open-ended and structured questions, respectively. Participant demographic characteristics are summarized in Supplementary Table 35, and the complete survey instrument is available in Supplementary Note 6.
Reporting summary
Further information on research design is available in the Nature Portfolio Reporting Summary linked to this article.