Alones Creative
Introduction
The tech-heavy market has bounced back sharply last week. Since August 9, the Invesco QQQ Trust ETF has jumped up about 9.2%. The VIX might have peaked at over 65 at one point on August 5. This is the highest level that VIX has reached since the peak of the COVID-19 pandemic. The cooling down VIX may signal a short-term bottom for the major market indices. Investors may want to look into growth stocks with sharp pullbacks so far in August and pick up good companies for the remaining part of 2024 and beyond.
On the other hand, the rather disturbing headlines, such as SA news’ “Tech layoffs surge, led by mass purges at Intel, Cisco“, keep reminding technology investors of the importance of stock selections.
REX FANG & Innovation Equity Premium Income ETF (NASDAQ:FEPI) is not the one I would recommend to buy because of its strategy and portfolio structure, which I will discuss in detail later. Collecting income from option premiums is an excellent idea, especially for those who want to dip their toes into the growth but volatile market areas. Many actively managed ETFs have emerged recently to take advantage of the covered calls. I will discuss some of them in conjunction with FEPI to share my insights. There are better alternatives to consider than FEPI for income investors.
FEPI ETF Overview
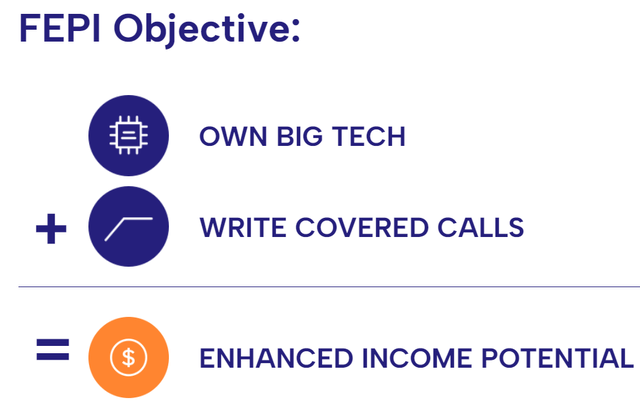
FEPI is an actively managed ETF with the following goal statement.
FEPI Objective – from rexshares.com
The ETF’s portfolio can be summarized as:
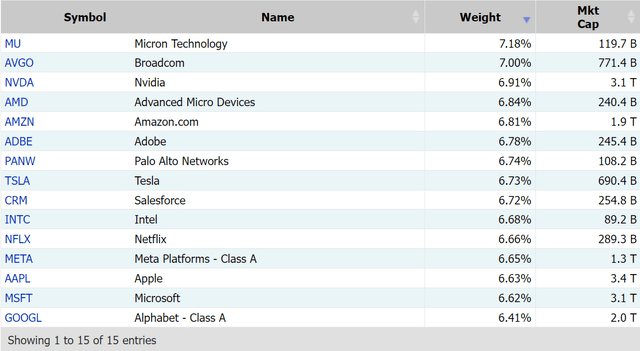
Equally weighted and includes 15 highly liquid stocks focused on building tomorrow’s technology today.
The following is the current list of the 15 holdings in the portfolio:
FEPI Holdings – from marketchameleon.com
It is fair to say that the list has the biggest market caps, which all exceed $100B with the exception of Intel (INTC) (after the recent big price drop), in the technology space including “the magnificent 7” (Mag 7) and semiconductor giants such as Broadcom (AVGO) and Nvidia (NVDA).
Some key characteristics of FEPI are listed below:
- Market Cap: $346.3M.
- Inception: October 11, 2023. It is a new ETF. More time is needed to validate its strategy.
- Yield: 21.2%.
- Volatility (WK-52 HV): 17.1. It is very high for an income-focused ETF.
- Risk Score (Morningstar): 91. It is considered to be very aggressive.
Why is FEPI’s Portfolio Questionable
When I was asked by my readers in SA to take a look at FEPI the first time around, I was a bit puzzled by the “Innovation” and “Premium” aspects in its name for two reasons. 1) FEPI is not Mag 7 “overweight” due to its equal weight structure. In other words, the other holdings will have the same “innovation” and “premium” status as Mag 7 stocks. It might be fine for playing the next tier for more innovation growth. But in reality, it is very difficult to find the right selections without market capitalization weighting. 2) the choice of INTC and MU lead me to believe that the management’s premium choices are very different. SA database shows that 3-year CAGR metrics for INTC and MU are -10.78% and -5.70%, respectively. They are the only constituents in FEPI’s portfolio that have shown negative revenue growth over the past 3 years.
It’s not surprising to me to see that FEPI got clobbered in recent weeks due largely to about 30% drops in both INTC and MU over the last two months.
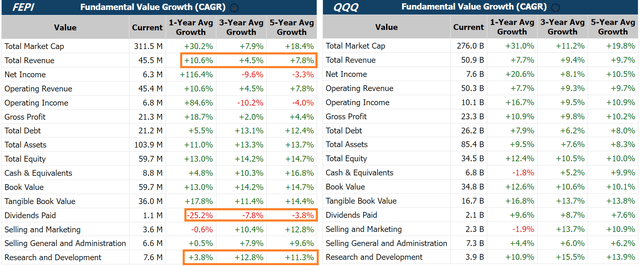
The following growth comparison between FEPI and QQQ will provide more comprehensive insights. The revenue growth has been significantly slower than QQQ. The 1-year growth is better at 10.6%, which may be largely due to the cycle from the semiconductor industry, hence not considered to be “secular”.
Growth Comparison (FEPI and QQQ) – from marketchameleon.com
The most alarming metric is in Research & Development Growth. FEPI is consistently lower than QQQ. 3.8% 1-year growth can hardly be called “innovation” sufficient, which should be in double digits based on the historical data. As discussed earlier, the two main drags on FEPI’s CAGR metrics are INTC and MU.
Obviously, the management must have seen something I did not see when INTC was selected as one of the 15 holdings. However, with the latest development with INTC, one can clearly see that INTC has been struggling for quite some time.
The following is from Intel’s CEO on August 1 (in the same SA new, as linked in Introduction section) when announcing the big layoff:
Our revenues have not grown as expected – and we’ve yet to fully benefit from powerful trends, like AI. Our costs are too high, our margins are too low. We need bolder actions to address both – particularly given our financial results and outlook for the second half of 2024, which is tougher than previously expected.
If I just look at what the CEO stated above, INTC stock should be avoided as an innovation growth play right now. The AI train has already left the station, it will cost much more to do catch-up. According to the CEO, the costs are already too high right now, and I would expect the costs to be much higher in the future to grow INTC’s AI competency and grab the AI market shares. I hope that FEPI’s management will have the same understanding as mine in the future update of its “innovation” portfolio.
At the portfolio level, the choice of 15 holdings is kind of a mystery to me. Fifteen is not viewed as meeting the minimum diversification requirement. It does not seem to come from the “alpha” considerations by selecting the top 15. The equal-weight structure would only work if all the choices are considered at the similar “premium” level in their corresponding industries. I have to admit that I have very little confidence in the portfolio to outperform based on its current innovation and premium properties.
A Few Alternative Approaches to Consider
I have a generally very positive view on the growth income ETFs which use coverall calls to generate income. The portfolios can be easily constructed thanks largely to the ultra-popular and successful ETF QQQ, with around 100 top technology companies.
Typically, the price performance is expected to be similar due to the same underlying portfolio. However, the strike prices of the call-writing make quite some difference because QQQ is a volatile ETF. Far out, OTM (out of money) will preserve much of the upside appreciation. The closer to the money calls will increase the capped amount for gains. However, on the other side, the downside effects are just the opposite. The closer to the money, the better price protection will be.
The approach is viewed as conservative if the strike price is close to the money, while the aggressive end of the spectrum will be on the far OTM side.
QYLD – Global X NASDAQ 100 Covered Call ETF. The most conservative. Lowest volatility and lowest performance gain.
- Global X Nasdaq 100 Covered Call ETF | NASDAQ: QYLD
- Market Cap: $8.0B
- Yield: 11.5%
- Volatility (WK-52 HV): 9.4
- Risk Score (Morningstar): 42
JEPQ – JPMorgan Equity Premium Income ETF
- Market Cap: $14.7B
- Yield: 10.2%
- Target Strike: 2.5%
- Volatility (WK-52 HV): 12.9
- Risk Score (Morningstar): 42
YMAX – YieldMax Universe Fund of Option Income ETFs. YMAX has injected volatility into the income strategy.
- Market Cap: $270.2M
- Yield: 44.1%. It is the highest yield, due to the volatility focus
- Volatility (WK-52 HV): 18.7. It is the most volatile, as expected
- Risk Score (Morningstar): 2. It is the most conservative. I’ve called it “new SWAN“
NUSI – Cashing QQQ For Smart Growth Income Rotation. See more details in my previous article.
- Market Cap: $335.1M
- Yield: 7.5%
- Volatility (WK-52 HV): 13.7
- Risk Score (Morningstar): 53
The following shows the total performance comparison among these ETFs, together with SP500 and QQQ. The time frame is January 17, 2024 (when YMAX was incepted) to August 16, 2024.
Price Performance Comparison – from SA charting
Notice the above chart is given here for reference only, due to the limited time duration. I will provide the following insights based on the ETFs’ characteristics. Readers are welcome to use future data or past data to verify and draw their own conclusions for their trading decisions.
- The most risk conservative approach is based on the selling of covered calls close to the trading price (or at the money). The price performance is capped the most, so the limited price upside is expected. A good example here is QYLD. The most noticeable characteristic is the low volatility. The ETFs at this end of the spectrum tend to outperform the rest during the down and flattish QQQ market.
- On the other end of the spectrum, the ETF could sell covered calls or be compensated by buying long calls such as NUSI. The yield will be smaller, but the price performance will likely be better. The ETFs in this category will have high volatility and tend to have worse performance during the downtrend. However, the price recovery will generally be faster and have better price gains.
- Selling volatility-based calls is a new type of strategy. Over the long run, I believe the total performance would still be similar to the above, depending on the aggressiveness of selecting the strike price to sell the calls. However, in the short run, the volatility could have a big impact on the price performance both in terms of capping and recovery. In other words, fast and volatile moves in either direction (up or down) will cause underperformance compared to the underlying portfolios (also known as “price erosion“). Ultra yield such as 40% or higher can be often seen with implied volatility over 50.
FEPI appears to be an “outlier” due to its “secretive” portfolio selection. As shown above, it does have the worst market characteristics in the group, such as HV and risk score. Unless something changes drastically, I would expect FEPI to be sitting on the lowest end on my recommendation list. I rate FEPI as a hold.
Risks and Caveats
The FEPI portfolio still has a large portion allocated in the growing stocks and some of the best innovation companies. It is a fine set of stocks overall. Existing holders may still find it comfortable to hold FEPI shares for the long term. For example, some may still have faith in the INTC stock or FEPI’s management to replace INTC with another “smart” choice. The risks of the management’s innovation choices should be watched closely.
Closing Thoughts
ETFs that are selling calls have attracted a lot of interest from income investors. These investors should be well-informed about the strategy and structures of these ETFs before allocating substantial amounts of their money into the ETFs. FEPI’s premium and innovation “labeled” approach has not been proven yet. Its portfolio total holdings and individual choices are viewed as “unconventional”. They have not shown evidence to beat the conventional covered call ETFs during their short history. Income investors will be better off looking for alternative solutions, including the larger and more popular ETFs in that category. I expect the yield around 10% to be a reasonable starting point for an interested investor to get the positioning going in the portfolio. Excessive yields, such as those exceeding 20% (FEPI and YMAX), typically involve complex (including proprietary) mechanisms that may bring management and/or operational risks, which require additional management that will likely rely on individual investors themselves.


